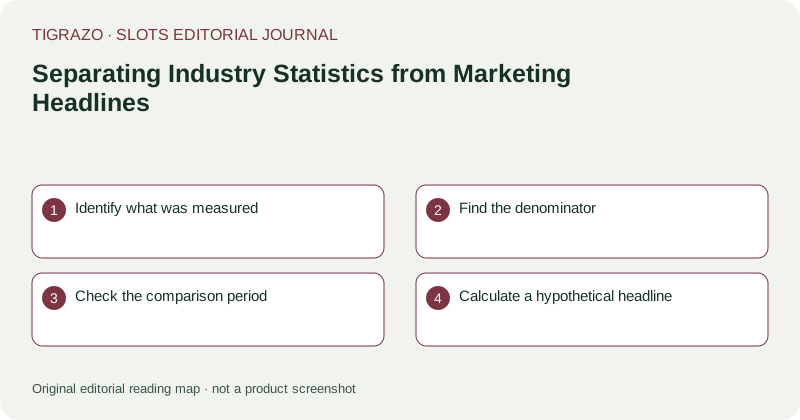
Identify what was measured
Revenue, wager volume, game launches, active accounts and survey preferences are different quantities. A rise in one does not automatically establish a rise in another. For example, increased wager volume does not by itself reveal whether there were more participants or more activity per participant. An article should use the metric's actual name rather than replacing it with a broader word such as demand or popularity.
Find the denominator
A market-share percentage needs a defined market. A survey result needs a defined sample and question. A feature-adoption figure needs a set of games, operators or releases from which it was calculated. Without the denominator, readers cannot assess what the percentage includes or excludes. A statistic from one catalogue should not silently become a statement about every slot available in every jurisdiction.
Check the comparison period
Month-on-month and year-on-year changes answer different questions. Seasonal patterns can make the choice important. A partial period should not be compared with a complete one without explanation. Also distinguish the date data were collected from the date a report was published. Calling older measurements current merely because the press release is recent creates a misleading sense of timeliness.
Calculate a hypothetical headline
If a hypothetical count rises from twenty releases to thirty, the increase is ten releases, or fifty percent of the original twenty. Saying it rose by ten percent would be incorrect. Conversely, a rise in share from twenty percent to thirty percent is ten percentage points and a fifty-percent relative increase. Naming the unit prevents two mathematically different descriptions from being confused.
Ask what the statistic cannot show
- Does the sample represent the claimed population?
- Are definitions consistent across periods?
- Were missing observations excluded?
- Is a commercial outcome being framed as a player benefit?
- Does the headline imply causation from a simple association?
A growth statistic does not prove improved game quality, accessibility or expected return. Nor does a high activity figure make participation suitable for any individual reader. Those are separate claims requiring separate evidence.
Good statistical coverage can retain a striking number while narrowing its interpretation. It states what changed, by how much, over which period and within which scope. When methodology is unavailable, that absence belongs in the explanation rather than being concealed behind a confident marketing headline.
Absolute numbers help readers assess scale. A large percentage increase from a tiny baseline can remain a small numerical change. Where the underlying counts are supplied, report both forms rather than allowing a relative-growth headline to imply an unspecified market-wide transformation.